India has 100k records on iNaturalist

22 Apr

Biodiversity citizen scientists use iNaturalist to post their observations with photographs. The observations are then curated there by crowd-sourcing the identifications and other trait related aspects too. The data once converted to “research grade” is passed on to GBIF as occurrence records.

Exciting news from India in 3rd week of April 2019 is:

Being interested in biodiversity data visualizations and completeness, I was waiting for 100k records to explore the data. Here is what I did and found out.

Step 1: Download the data from iNaturalist website. Which can be done very easily by visiting the website and choosing the right options.

https://www.inaturalist.org/observations?place_id=6681

I downloaded the file as .zip and extracted the observations-xxxx.csv. [In my case it was observations-51008.csv].

Step 2: Read the data file in R

library(readr)
observations_51008 <- read_csv("input/observations-51008.csv")

Step 3: Clean up the data and set it up to be used in package bdvis.

library(bdvis)

inatc <- list(
  Latitude="latitude",
  Longitude="longitude",
  Date_collected="observed_on",
  Scientific_name="scientific_name"
)

inat <- format_bdvis(observations_51008,config = inatc)

Step 4: We still need to rename some more columns for ease in visualizations like rather than ‘taxon_family_name’ it will be easy to have field called ‘Family’

rename_column <- function(dat,old,new){
  if(old %in% colnames(dat)){
    colnames(dat)[which(names(dat) == old)] <- new
  } else {
    print(paste("Error: Fieldname not found...",old))
  }
  return(dat)
}

inat <- rename_column(inat,'taxon_kingdom_name','Kingdom')
inat <- rename_column(inat,'taxon_phylum_name','Phylum')
inat <- rename_column(inat,'taxon_class_name','Class')
inat <- rename_column(inat,'taxon_order_name','Order_')
inat <- rename_column(inat,'taxon_family_name','Family')
inat <- rename_column(inat,'taxon_genus_name','Genus')

# Remove records excess of 100k
inat <- inat[1:100000,]

Step 5: Make sure the data is loaded properly

bdsummary(inat)

will produce some like this:

Total no of records = 100000 

 Temporal coverage...
 Date range of the records from  1898-01-01  to  2019-04-19 

 Taxonomic coverage...
 No of Families :  1345
 No of Genus :  5638
 No of Species :  13377 

 Spatial coverage ...
 Bounding box of records  6.806092 , 68.532  -  35.0614769085 , 97.050133
 Degree celles covered :  336
 % degree cells covered :  39.9524375743163

The data looks good. But we have a small issue, we have some records from year 1898, which might cause trouble with some of our visualizations. So let us drop records before year 2000 for the time being.

inat = inat[which(inat$Date_collected > "2000-01-01"),]

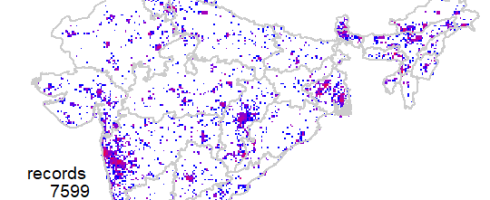
Now we are ready to explore the data. First one I always like to see is geographical coverage of the data. First let us try it at 1 degree (~100km) grid cells. Note here I have Admin2.shp file with India states map.

mapgrid(inat,ptype="records",bbox=c(60,100,5,40),
        shp = "Admin2.shp")

mapgrid1_c

This shows a fairly good geographical coverage of the data at this scale. We have very few degree cells with no data. How about fines scale though? Say at 0.1 degree (~10km) grid. Let us generate that.

mapgrid(inat,ptype="records",bbox=c(60,100,5,40),
        shp = "Admin2.shp",
        gridscale=0.1) 

mapgrid2_c

Now the pattern is clear, where the data is coming from.

To be continued…

References

Darwinazing biodiversity data in R

14 Mar

“Darwin Core (DwC) is a standard maintained by the Darwin Core maintenance group. It includes a glossary of terms (in other contexts these might be called properties, elements, fields, columns, attributes, or concepts) intended to facilitate the sharing of information about biological diversity by providing identifiers, labels, and definitions. Darwin Core is primarily based on taxa, their occurrence in nature as documented by observations, specimens, samples, and related information.” Darwin Core website

DwC is an evolving community-developed biodiversity data standard (Wieczorek et al. 2012). In simple words, it’s a list and definitions of common biodiversity data terms, ~200 of them, for more details see DwC quick reference guide. Today, hundreds of millions of biodiversity records from around the world are published in DwC format and aggregated into various portals (e.g. GBIF, vertNet, iDigBio). Nonetheless, data publishers still struggle with the essential step of mapping fields in their data to the terms in Darwin Core (Wieczorek et al. 2017a). Doing so requires a good understanding of both the data set and Darwin Core (Wieczorek et al. 2017b).

Related work

The remarkable Kurator project creates biodiversity data quality workflows, and via it web interface (Kurator-Web)– data quality-control is highly accessible. Thanks to this invaluable project, we have easy access to different lookup tables, that aggregates rare and highly valuable data regarding DwC vocabularies. For example in the Darwin Cloud table, knowledge is being accumulated about variations in DwC field names. Fully utilizing these precious data in the R environment can significantly enhance our ability to address more biodiversity data quality issues.

Details of project

Darwinizer workflow in R:

While DwC was adopted by most biodiversity data publishers, it implementation is somewhat incomplete. Imposing controlled vocabulary on millions of records is a complex and daunting task. For example, there are inconsistencies regarding field names between different data publishers. The CSV File Darwinizer Kurator workflow standardizes field names to the DwC standard name, thanks to the Darwin Cloud lookup file. By generating this workflow in R, we can easily input a wider range of data from different publishers. This module needs to work on various data files downloaded from different biodiversity portals, and handle all of them.

Data checks:

Data checks must be specifically tailored around the structure of the data, in our case- the DwC standard. Under this module we will address three major data checks collections:

  • TDWG core suite of tests and assertions: Tests and rules generating assertions at the record-level are more fundamental than the tools or workflows that will be based on them. Ideally, this core suite of data quality checks need to be embrace by all data publishers (as a standard), and hopefully in the long term, this will be the case. However, in the short term, since constructing many of them in R is rather feasible we plan to achieve that. Furthermore, embracing this standard will improve our ability to properly manage data checks. In Ashwinand Thiloshon last year GSoC projects various data checks have been developed, while some adjustment and further development is still required.
  • Imposing controlled vocabulary on key data fields: Using Kurator’s vocabulary data, different DwC standardization procedures can be addressed. The challenge will be to assess and prioritize the development of these procedures.
  • New frontiers: Enriching DwC data (i.e. accurately joining external data) can greatly boost data checks capacity and diversity. For example, joining species trait data, or retrieving climatic data for each record opens variety of check capabilities. Here we need to screen for robust data enrichment procedures in R and design exciting data checks around them.

R based Kurator actors:

Following a communication with the Kurator development team, we will explore the development of R actors (functions), that hopefully, will be seemingly integrated into the kurator infrastructure. Handling some Java and Python code will be required.

Expected impact

Improving the quality of biodiversity research, in some measure, is based on improving user-level data cleaning tools and skills. Adopting a more comprehensive approach for incorporating data cleaning as part of data analysis will not only improve the quality of biodiversity data, but will impose a more appropriate usage of such data.

If you are a full time University student and would like to participate in Google Summer of Code 2018 helping us build this, the project idea is listed here which has further details on how to start.

Google Summer of Code 2018

13 Mar

R project has been participating in Google Summer of Code (GSoC) since 2008. We have numerous packages which have received code contributions from GSoC participants. This year too, R is participating and there is already an impressive list of potential projects listed at [https://github.com/rstats-gsoc/gsoc2018/wiki/table-of-proposed-coding-projects] and the project mentors are seeking students to work on these projects.

Home  Google Summer of Code - Google Chrome 3132018 94546 AM.jpg

The applications are open now and students have time till 27th March 2018 to complete the applications. If you know any full time university students interested in R, this is a great opportunity to contribute some code and earn stipend over summer.

Resources:

GSoC 2017 : Parser for Biodiversity Checklists

31 May

Guest post by Qingyue Xu

Compiling taxonomic checklists from varied sources of data is a common task that biodiversity informaticians encounter. In the GSoC 2017 project Parser for Biodiversity checklists, my overall goal is to extract taxonomic names from given text into a tabular format so that easy aggregation of biodiversity data in a structured format that can be used for further processing can be facilitated.

I mainly plan to build three major functions which serve different purposes and take various sources of text into account.

However, before building functions, we need to first identify and cover as many different formats of scientific names as possible. The inconsistencies of scientific names make things complicated for us. The common rules for scientific names follow the order of:

genus, [species], [subspecies], [author, year], [location]

Many components are optional, and some components like author and location can be one or even more. Therefore, when we’re parsing the text, we need to analyze the structure of the text and match it with all possible patterns of scientific names and identify the most likely one. To resolve the problem more accurately, we can even draw help from NLTK (Natural Language Toolkit) packages to help us identify “PERSON” and “LOCATION” so that we can analyze the components of scientific names more efficiently.

Function: find_taxoname (url/input_file, output_file)

  • Objective: This is a function to search scientific names with supplied texts, especially applied to the situation when the text is not well structured.
  • Parameters: The first parameter is the URL of a web page (HTML based) or the file path of a PDF/TXT file, which is our source text to search for the biology taxonomic names. The second parameter is the file path of the output file and it will be in a tabular format including columns of the genus, species, subspecies, author, year.
  • Approach: Since this function is intended for the unstructured text, we can’t find a certain pattern to parse the taxonomic names. What we can do is utilizing existing standard dictionaries of scientific names to locate the genus, species, subspecies. By analyzing the surrounding structure and patterns, we can find corresponding genus, species, subspecies, author, year, if they exist, and output the findings in a tabular format.

Function: parse_taxolist(input_file, filetype, sep, output_file, location)

  • Objective: This is a function to parse and extract taxonomic names from a given structured text file and each row must contain exactly one entry of the scientific names. If the location information is given, the function can also list and return the exact location (latitude and longitude) of the species. The output is also in a tabular format including columns of genus, species, subspecies, author(s), year(s), location(s), latitude(s), longitude(s).
  • Parameters: The first parameter is the file path of the input file and the second parameter is the file type, which supports txt, PDF, CSV types of files. The third parameter ‘sep’ should indicate the separators used in the input file to separate every word in the same row. The fourth parameter is the intended file path of the output file. The last parameter is a Boolean, indicating whether the input file contains the location information. If ‘true’, then the output will contain detailed location information.
  • Approach: The function will parse the input file based on rows and the given separators into a well-organized tabular format. An extended function is to point the exact location of the species if the related information is given. With the location info such as “Mirik, West Bengal, India”, the function will return the exact latitude and longitude of this location as 26°53’7.07″N and 88°10’58.06″E. It can be realized through crawling the web page of https://www.distancesto.com/coordinates or utilizing the API of Google Map. This is also a possible solution to help us identify whether the content of the text represents a location. If it cannot get exact latitude and longitude, then it’s not a location. If a scientific name doesn’t contain location information, the function will return NULL value for the location part. If it contains multiple locations, the function will return multiple values as a list as well as the latitudes and longitudes.

Function: recursive_crawler(url, htmlnode_taxo, htmlnode_next, num, output_file, location)

  • Objective: This function is intended to crawl the web pages containing information about taxonomic names recursively. The start URL must be given and the html_node of the scientific names should also be indicated. Also, if the text contains location info, the output will also include the detailed latitude and longitude.
  • Parameters: The first parameter is the start URL of the web page and the following web pages must follow the same structure as the first web page. The second parameter is the html_node of the taxonomic names, such as “.SP .SN > li”. (There’re a lot of tools for the users to identify the HTML nodes code for certain contexts). The third parameter is the html_node of the next page, which can lead us to the next page of another genus. The fourth parameter ‘num’ is the intended number of web pages the user indicates. If ‘num’ is not given, the function will automatically crawl and stop until the htmlnode_next cannot return a valid URL. The next two parameters are the same with the above two functions.
  • Approach: For the parsing part and getting the location parts, the approach is the same as the above functions. For the crawling part, for a series of structured web pages, we can parse and get valid scientific names based on the given HTML nodes. The HTML nodes for the next pages should also be given, and we can always get the URL of the next page by extracting it from the source code. For example, the following screenshot from the web page we used provides a link which leads us to the next page. By recursively fetching the info from the current page and jump to the following pages, we can output a well-organized tabular file including all the following web pages.
  • Other possible functionalities to be realized

Since inconsistencies might exist in the format of scientific names, I also need to construct a function to normalize the names. The complication always lies in the author part, and there can be two approaches to address the problem. The first one is still analyzing the structure of the scientific name and we can try to capture as many exceptions as possible, such as author names which have multiple parts or there’re two authors. The second approach is to draw help from the NLTK package to identify possible PERSON names. However, when it gets too complicated, the parsing result won’t be very accurate all the time. Therefore, we can add a parameter to suggest how reliable our result is and indicate the need for further manual process if the parser cannot work reliably.


GSoC 2017 : Biodiversity data cleaning

17 May

By Ashwin Agrawal

URL of the Project Idea: https://github.com/rstats-gsoc/gsoc2017/wiki/Biodiversity-data-cleaning

Introduction

There are an increasing number of scientists using R for their data analyses, however, the skill set required to handle biodiversity data in R, is considerably varies. Since, users need to retrieve, manage and assess high volume data with complex structure (Darwin Core standard, DwC); only users with an extremely sound R programming background can attempt this. Recently, various R packages dealing with biodiversity data and specifically data cleaning have been published (e.g. scrubr, biogeo, rgeospatialquality, assertr , and taxize). Though numerous new procedures are now available, implementing them requires users to prepare the data according to the formats of each of these packages and learning each R package. Dealing with the integration related tasks which would facilitate the data format conversions and smooth execution of all the available data cleaning functions from various packages, is being addressed in another GSOC project (link). The purpose of my project is to identify and address missing crucial functionalities for handling biodiversity (big) data in R. Properly addressing these gaps will hopefully enable us to offer a more complete framework for data quality assessment in R.

Proposed components

1. Standardized flagging system:

Biodiversity quality assessment is based upon a user capability to execute variety of data checks. Thus, a well-designed flagging system will allow users to easily manage their data checks result, and facilitate control on the desired quality level on one hand, and user flexibility on the other hand. I will assess several approaches for designing such a system, factoring comprehensibility and programming complexity.

Any insights and ideas regarding this task will be highly appreciated (please create a github issues).

2. A DwC summary table:

When dealing with high complexity and high-volume data, summary statistics of different fields and categories, can have an immense value. I will develop a DwC summary table based on DwC fields and vocabulary. First, I will explore different R packages dealing with descriptive statistics and table visualizations. Then, I will map key DwC data fields and key categories for easy faceting of the summary table. In addition, the developed framework can be used to enhance the flagging system, by utilizing it unique functionality to summarize the data quality checks results.

3. Outliers analysis:

Identifying spatial, temporal, and environmental outliers can single out erroneous records. However, identifying an outlier is a subjective exercise, and not all outliers are errors.  I will develop a set of functions which will aid in detection of outliers. Various statistical methods and techniques will be evaluated (e.g. Reverse Jackknife, Standard Deviations from the Mean, Alphahull).

4. Developing new data quality checks and procedure

I will identify critically missing spatial, taxonomic and temporal data cleaning routines, factoring users need level and programming complexity.  Ideas and needs regarding this task will be highly appreciated (please create a github issues).

Significance

Improving the quality of biodiversity research, in some measure, is based on improving user-level data cleaning tools and skills. Adopting a more comprehensive approach for incorporating data cleaning as part of data analysis will not only improve the quality of biodiversity data, but will impose a more appropriate usage of such data. This can greatly serve the scientific community and consequently our ability to address more accurately urgent conservation issues.

Feedback

For feedback, suggestions please post them on github issues

GSoC 2017 : Integrating biodiversity data curation functionality

8 May

By Thiloshon Nagarajah

Any data used in data science analyses, either it be simple statistical inference-making or high end machine learnings, needs to meet certain quality. Any dataset has ‘Signal’ the answer we are trying to find and ‘Noise’ the disturbances and anomalies in the data. The important part of preparing data for any analysis is to make it easier to distinguish noise from data. In biodiversity researches,  the data can be very large in number. Thus there is high probability of having a lot of noise. Giving control to researchers on this noise reduction will provide a clean and tidy data. 

Biodiversity research is a huge spectrum. It varies from analyzing simple heredity, climate and Eco-system impacts on species to complex Genome Sequencing researches. So the requirements of data in each of these fields vary with the type of researches. Taxonomic researchers will be interested in taxonomic fields and not so in spatial or temporal aspects of the data. They will be okay with loosing spatial data in compensation for better taxonomic data. Whereas the spatial related researchers will be lousy on taxonomic fields but not on spatial fields. This application-specific control on cleaning and preparing data helps in having an immensely efficient subsequent processes. 

The gist of this project and it’s sister project (Biodiversity data cleaning done by Ashwin Agrawal) is to provide this customizable control over cleaning of the data. The cleaning and standardization is not done on the fly, it’s customized, tweaked and refined as per user needs. The controls for that will be given by our solution. The brief proposal of our solution is given below. For the full proposal, click here.


Introduction

The importance of data in the biodiversity research has been repeatedly stressed in the recent times and various organizations have come together and followed each other to provide data for advancing biodiversity research. But, that is exactly where the main hiccup of biodiversity research lies. Since there are many such organizations, the data aggregated by these organizations vary in precision and in quality. Further, though in recent times more researchers have started to use R for their data analyses, since they need to retrieve, manage and assess data with complex (DwC) structure and high volume, only researchers with extremely sound R programming background have been able to attempt this.

Various R packages created so far have been focused on addressing some elements of the entire process. For example

Thus when a researcher decides to use these tools, he needs to

  1. Know these packages exist
  2. Understand what each package does
  3. Compare and contrast packages offering same functionalities and decide the best for his needs
  4. Maintain compatibility between the packages and datasets transferred between packages.

What we propose:

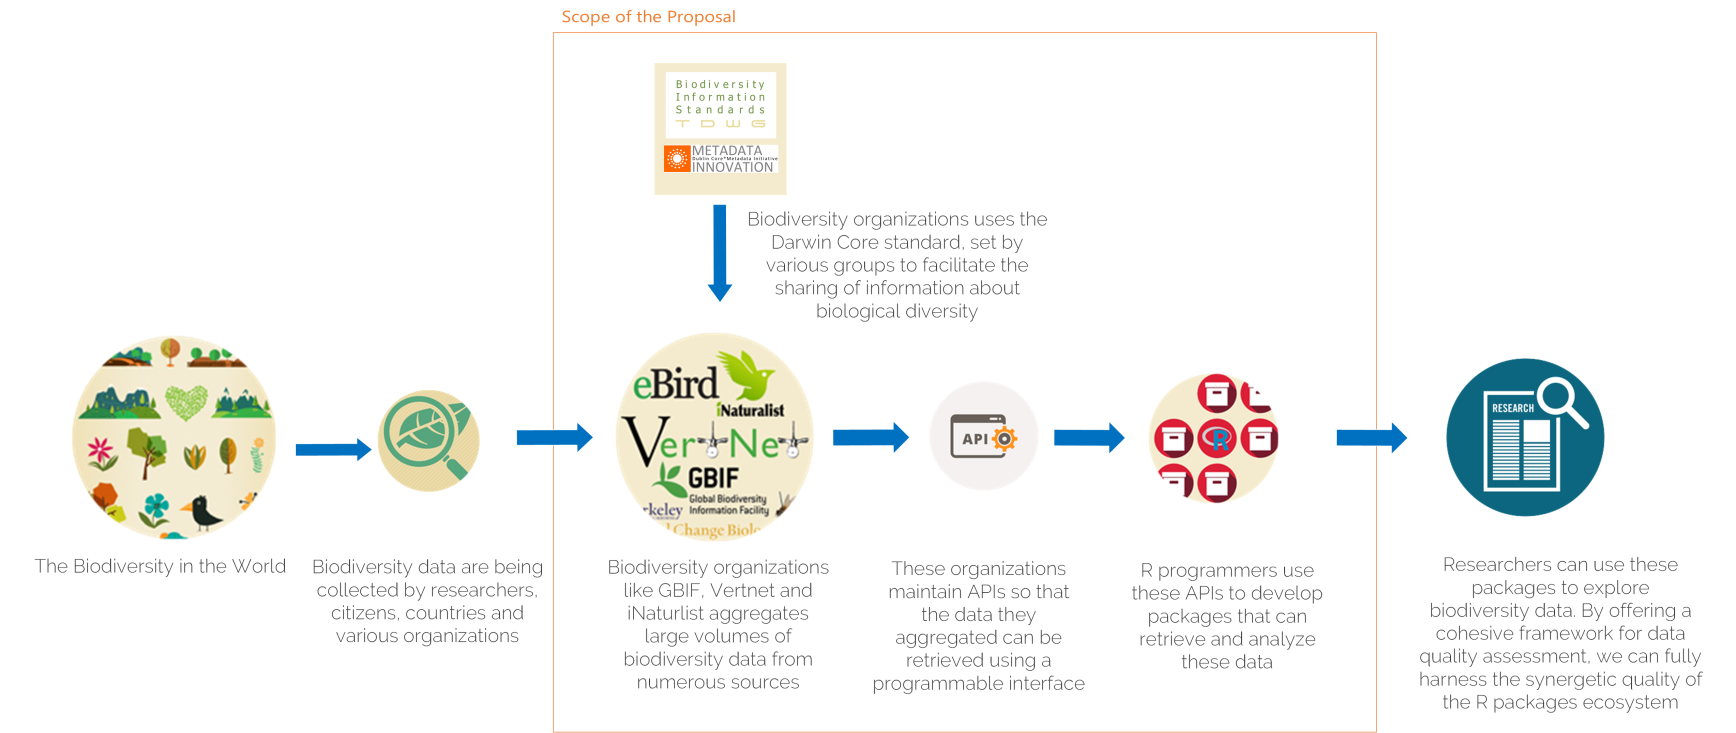
We propose to create a R Package that will function as the main data retrieval, cleaning, management and backup tool to the researchers. The functionalities of the package are culmination of various existing packages and enhancements to existing functions rather than creating one from the scratch. This way we can cultivate the existing resources, collaborative knowledge and skills and also address the problem we identified efficiently. The package will also address the issue of researchers not having sound R programming skills.

Before we analyze solutions, it’s important to understand the stakeholders and scope of the project.

blog_img01

Data Flow

Proposed Package:

The package will cover major processes in the research pipeline.

  1. Getting Biodiversity data to the workspace
    The biodiversity data can be read from existing DwC archive files in various formats (DwCA, XML, CSV) or it can be downloaded from online sources (GBIF, Vertnet). So functions to read local files in XML, DwCA and CSV formats, to download data directly from GBIF and to retrieve from respective APIs will be included. In case the user doesn’t know what data to retrieve the name suggestion functions will also be included. Converting common name to scientific name, scientific name to common name, getting taxon keys to names will also be covered. Further functions to convert to simple data frames to retrieve medias associated with occurrences will also be included.
  2. Flagging the data
    The biodiversity data is aggregated by various different organizations. Thus these data vary in precision and in quality. It is highly necessary to first check the quality of the data and strip the records which lacks the quality expected before using it. Various packages built thus far have been able to check data for various discrepancies such as scrubr and rgeospatialquality. Integrating functionalities given by such packages to produce a better quality control will benefit the community greatly. The data will be checked for following discrepancies

    1. In spatial – Incorrect, impossible, incomplete and unlikely coordinates and invalid country and country codes
    2. In temporal – missing or incorrect dates in all time fields
    3. In taxonomic – epithet, scientific name and common name discrepancies and also fixing scientific names.
    4. And duplicate records of data will be flagged.
  3. Cleaning data
    The process is done step by step to help user configure and control the cleaning process.
    The data will be flagged first for various discrepancies. It can be any combination of spatial, temporal, taxonomic and duplicate flags as user specifies. Then the user can view the data he will be losing and decide if he wants to tweak the flags. In times when the data is high in volume, this procedural cleaning would help user for number of reasons.

    1. When user wants multiple flags, he can apply each quality check one by one and decide if he wants to remove flagged data once he applies one check. If he is to apply all flags at once the records to be removed will be high in number and he has to put much effort to go through all of it to decide if he wants that quality check
    2. When user views the flagged data, not all fields will be shown. Only the fields the quality check was done on and the flagged result will be shown. This saves user from having to deal with all the complex fields in the original data and having to go to and forth the data to check the flags.
      If he is satisfied with the records he will lose then, the data can be cleaned.

    Ex:

    # Step 01
    biodiversityData
          %>% coordinateIncompleteFlag()
          %>% allFlags(taxonomic)
    
    #Step 02
    viewFlaggedData()
    
    #Step 03
    cleanAll()
    
    
  4. Maintaining backups of dataThe original data user retrieved and any subsequent resultant data of his process can be backed up with versioning to maintain reproducibility. Functions for maintaining repositories, backing up to repositories, loading from repositories and achieving will be implemented.

Underneath, the package we plan to implement these:

  1. Standardization of dataThe data retrieved will be standardized according to DwC formats. To maintain consistency and feasibility I have decided to use GBIF fields as the standard. The reasons are,
    1. The GBIF uses DwC as the standardization and the fields from GBIF backbone complies with DwC terms.
    2. GBIF is a well-established organization and using the fields from their backbone will assure consistency and acceptance by researchers.
    3. GBIF is a superset of all major biodiversity data available. Any data gathered from GBIF can be expected to also be in other sources too.
  2. Unique fields grouping system for DwC fields, based on recommended grouping (see this and this)

Conclusion

We believe a centralized data retrieval, cleaning, management and backup tool will benefit the bio diversity research community and eradicate many short comes in the current research process. The package will be built over the course of next few months and any insights, guidance and contributions from the community will be greatly appreciated.

Feedback

Please give us your feedback, suggestions on github issues

Mapping Biodiversity data on smaller than one degree scale

23 Feb

Guest Post by Enjie (Jane) LI

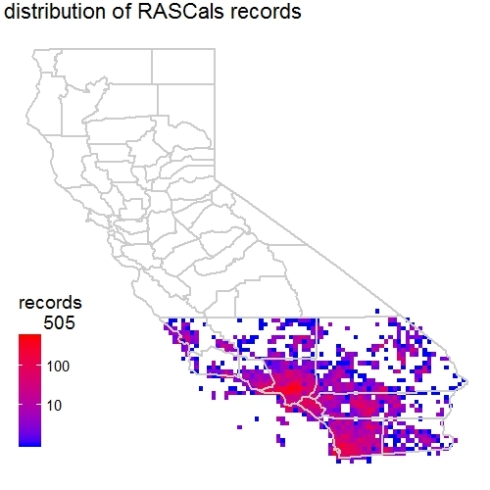
I have been using bdvis package (version 0.2.9) to visualize the iNaturalist records of RAScals project (http://www.inaturalist.org/projects/rascals).

Initially, the mapgrid function in the bdvis version 0.2.9 was written to map the number of records, number of species and completeness in a 1-degree cell grid (~111km x 111km resolution).

I applied this function to the RASCals dataset, see the following code. However, the mapping results are not satisfying. The 1 degree cells are too big to reveal the details in the study areas. Also, the raster grid was on top the basemap, which makes it really hard to associate the mapping results with physical locations.

library(rinat)
library(bdvis)

rascals=get_inat_obs_project("rascals")
conf <- list(Latitude="latitude",
             Longitude="longitude",
             Date_collected="Observed.on",
             Scientific_name="Scientific.name")
rascals <- format_bdvis(rascals, config=conf)
## Get rid of a record with weird location log
rascals <- rascals[!(rascals$Id== 4657868),]
rascals <- getcellid(rascals)
rascals <- gettaxo(rascals)
bdsummary(rascals)

a <- mapgrid(indf = rascals, ptype = "records",
             title = "distribution of RASCals records",
             bbox = NA, legscale = 0, collow = "blue",
             colhigh = "red", mapdatabase = "county",
             region = "CA", customize = NULL)

b <- mapgrid(indf = rascals, ptype = "species",
              title = "distribution of species richness of RASCals records",
              bbox = NA, legscale = 0, collow = "blue",
              colhigh = "red", mapdatabase = "county",
              region = "CA", customize = NULL)

rascals01

rascals02

I contacted developers of the package regarding these two issues. They have been very responsive to resolve them. They quickly added the gridscale argument in the mapgrid function. This new argument allows the users to choose scale (0.1 or 1). The default 1-degree cell grid for mapping.

Here are mapping results from using the gridscale argument. Make sure you have bdvis version 0.2.14 or later.

c <- mapgrid(indf = rascals, ptype = "records",
             title = "distribution of RASCals records",
             bbox = NA, legscale = 0, collow = "blue",
             colhigh = "red", mapdatabase = "county",
             region = "CA", customize = NULL,
             gridscale = 0.1)

d <- mapgrid(indf = rascals, ptype = "species",
             title = "distribution of species richness of RASCals records",
             bbox = NA, legscale = 0, collow = "blue",
             colhigh = "red", mapdatabase = "county",
             region = "CA", customize = NULL,
             gridscale = 0.1)

rascals03

rascals04

We can see that the new map with a finer resolution definitely revealed more information within the range of our study area. One more thing to note is that in this version developers have adjusted the basemap to be on top of the raster layer. This has definitely made the map easier to read and reference back to the physical space.

Good job team! Thanks for developing and perfecting the bdvis package.

References

Creating figures like the paper ‘Completeness of Digital Accessible Knowledge of Plants of Ghana’ Part 4

13 Dec

This is the fourth part of the of the post where are going to create figure 4 Plot of Inventory Completeness against sample size for grid cells. Part 3 of this series we created chronohorogram for understanding seasonality by year of the data records.

If you have not already done so, please follow steps in Part 1 of the post to set up the data. Since this functionality was recently added to package bdvis, make sure you have v 0.2.9 or higher installed on your system.

The first step to generate this plot will be to compute completeness of the data. Package bdvis provides us with a handy function for that, as long as we want to compute the completeness for a degree grid. This was partially covered in an earlier blog post.

comp = bdcomplete(occ)

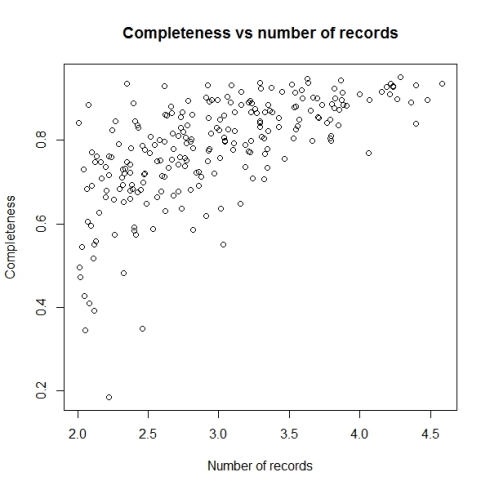
This command would return a completeness data matrix called comp and generate a plot of inventory completeness values (c) versus number of spices observed (sobs) in the data set as follows.

comp1

head(comp)
   Cell_id nrec   Sobs  Sest      c
 1 35536   3436   243   276.3514  0.8793151
 2 35537   4315   299   318.7432  0.9380592
 3 35538   518    152   187.4118  0.8110483
 4 35896   17148  320   343.9483  0.9303724
 5 35897   7684   300   338.8402  0.8853732
 6 35898   865    169   216.7325  0.7797632


The data returned has cell identification numbers, number of records per cell, number of observed and estimated species and the completeness coefficient (c).

The default cut off number of records per grid cell is 50, but let us set that to 100 so we can filter out some grid cells which are data deficient.

comp = bdcomplete(occ, recs=100)

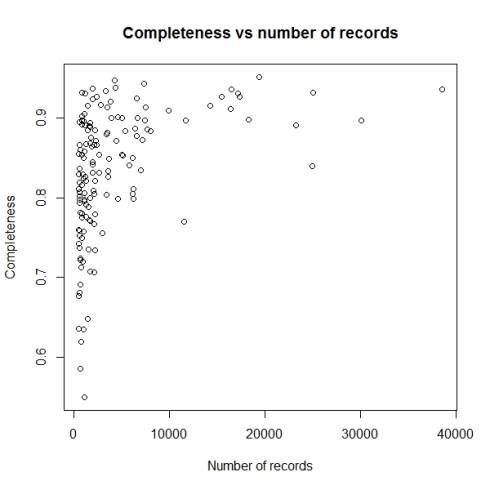
The graph we want to plot is Inventory Completeness (c) against sample size for grid cells (nrec) and not the one provided by default.

plot(comp$nrec, comp$c, main="Completeness vs number of species",
     xlab="Number of species", ylab="Completeness")

Will produce a graph like this:

comp2


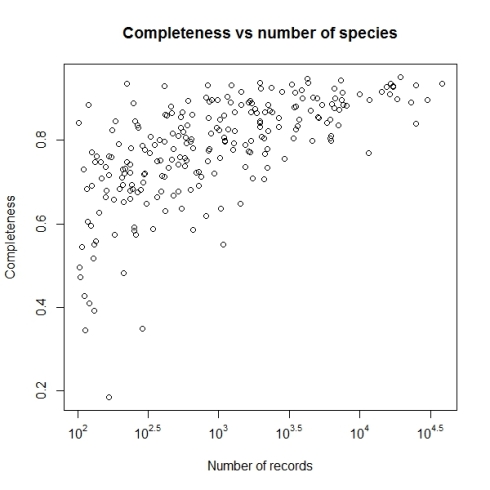
The problem with this graph is since there is very high variation in number of records per grid cell, majority of points having less than 5000 records are getting mixed up. So let us use log scale for number of records.

plot(log10(comp$nrec), comp$c, main="Completeness vs number of species",
     xlab="Number of species", ylab="Completeness")

comp3

Now this looks better. Let us change the x axis labels to some sensible values, to make this graph easy to understand. For that we will remove the current x axis labels by using xaxt parameter and then construct and add the tick marks and values associated.

plot(log10(comp$nrec),comp$c,main="Completeness vs number of species",
     xlab="Number of records",ylab="Completeness",xaxt="n")
atx <- axTicks(1)
labels <- sapply(atx,function(i) as.expression(bquote(10^ .(i))))
axis(1,at=atx,labels=labels)

comp4

Not let us add the lines to denote the cut off values of completeness we want to consider i.e. higher than 0.5 as inventory completeness values for cells having number of records greater than 1000.

abline(h = 0.5, v = 3, col = "red", lwd = 2)

comp5

Now we may set the point size and shape to match the figure in paper by using pch and cex parameters. The final plot code will be as follows:

plot(log10(comp$nrec),comp$c,main="Completeness vs number of species",
     xlab="Number of records",ylab="Completeness",xaxt="n",
     pch=22, bg="grey", cex=1.5)
atx <- axTicks(1)
labels <- sapply(atx,function(i) as.expression(bquote(10^ .(i))))
axis(1,at=atx,labels=labels)
abline(h = 0.5, v = 3, col = "red", lwd = 3)

comp6

If you have suggestions on improving the features of package bdvis please post them in issues in Github repository and any questions or comments about this post, please poth them here.

References

Creating figures like the paper ‘Completeness of Digital Accessible Knowledge of Plants of Ghana’ Part 3

22 Nov

This is the third part of the of the post where we are replicating the figures from a paper and in this part we are going to create figure 2 the Chronohorogram. Part 2 of this series we created temporal plot for understanding seasonality of the data records (Figure 1b).

If you have not already done so, please follow steps in Part 1 of the post to download and set up the data. Make sure you have v 0.2.9 or higher installed on your system.

To create a chronohorogram, is really very simple using our package bdvis.

chronohorogram(occ)

chrono1

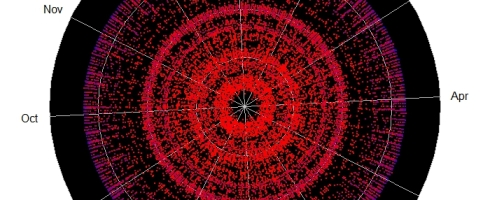
Though the command has created the diagram, it does not look right. The diagram does not cover the range of all years, represented in the data. Since we have used command without many paramaters, it has used default year values for start and end. Let us check what is the range of years we have in the data. For that we can simply use command bdsummary.

bdsummary(occ)
Total no of records = 1071315

Temporal coverage...
 Date range of the records from 1700-01-01 to 2015-06-07

Taxonomic coverage...
 No of Families : 0
 No of Genus : 0
 No of Species : 1565

Spatial coverage ...
 Bounding box of records 6.94423 , -83.65 - 89 , 99.2
 Degree celles covered : 352
 % degree cells covered : 2.34572837531654


This tells us that we have data available form 1700 till 2015 in this data set. Let us try by specifying starting year and let package decide the end year.

chronohorogram(occ, startyear = 1700)

chrono2

Looking at the diagram it is clear that we hardly have any data for first 150 years, i.e. before 1850, so let us generate the diagram with starting year as 1850.

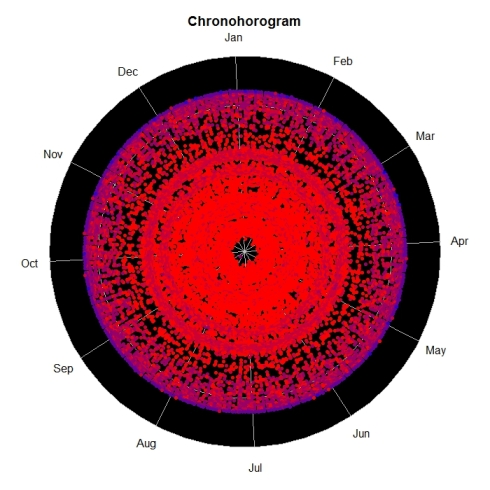
chronohorogram(occ, startyear = 1850)

chrono3

The diagram looks good except the points look smudged into each other, so let us reduce the point size to get the final figure.

chronohorogram(occ, startyear = 1850, ptsize = .1)

chrono4

If you have suggestions on improving the features of package bdvis please post them in issues in Github repository and any questions or comments about this post, please poth them here.

References

Creating figures like the paper ‘Completeness of Digital Accessible Knowledge of Plants of Ghana’ Part 2

8 Nov

Continuing from Part 1, in case you have not done so, please set up the data as described before we try to make this temporal polar plot.

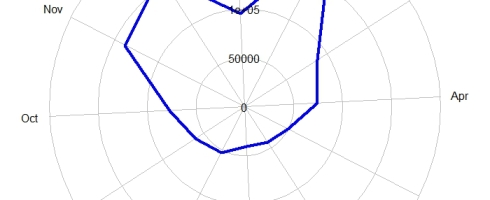
To create Figure 1b. Graph showing accumulation of records through time (during the year) we need  use function tempolar. This name ‘tempolar’ is simply a short of ‘temporal polar’. For this plot, we just count records for each Julian day, without considering the year. This tells us about seasonality of the data records.

Let us continue from the the previous part with code too, if if you do not have the data set up, please visit Part 1 and run the code.

First create just a very basic tempolar plot.

tempolar(occ)

Now this created the following graph:

Basic tempolar plot

This graph looks very different than what we want to create. This is plotting the data for each day, but the plot we want is for monthly data. Let us sue timescale = “m” to specify monthly data aggregation.

tempolar(occ,timescale = 'm')

Now this created the following graph:

monthly temporal plot

So now this is what we expected to have as a figure. One final thing is to add a better title.

tempolar(occ,timescale = 'm', color = "blue",
         title = 'Pattern of accumulation of records
                  of Indian Birds by month')

final tempolar


Currently the tempolar does not have ability to display values for each month. Is that very important and needs to be added? We would like to hear form the users.

If you have suggestions on improving the features of package bdvis please leave comments Github repository.

References