We are happy to announce that package bdvis is on CRAN now. http://cran.r-project.org/web/packages/bdvis/index.html
bdvis: Biodiversity Data Visualizations
Biodiversity data visualizations using R would be helpful to understand completeness of biodiversity inventory, extent of geographical, taxonomic and temporal coverage, gaps and biases in data.
As part of Google Summer of Code 2014, we hope to make progress on the development of this package and the proposed additions are posted here.
If you have never used package bdvis the following code will give you a quick introduction of the capabilities of the package.
First to install the package
install.packages("bdvis")
library(bdvis)
# We use rinat package to get some data from
# iNaturalist project
# install.packages("rinat")
library(rinat)
Now let us get some data from iNaturlist project ReptileIndia
inat=get_inat_obs_project("reptileindia")
239  Records
0-100-200-300
We need to convert the data in bdvis format.
- Use fixstr function to change names of two fields.
- Use getcellid function to calculate grid numbers for each records with coordinates.
- Use gettaxo function to fetch higher taxonomy of each record. This function will take some time to run and might need some human interaction to resolve names depending on the data we have.
# Function fixstr is now replaced with format_bdvis
# inat=fixstr(inat,DateCollected="Observed.on",SciName="Scientific.name")
inat=format_bdvis(inat,source='rinat')
inat=getcellid(inat)
inat=gettaxo(inat)
Our data is ready for trying out bdvis functions now. First a function to see what data we have.
bdsummary(inat)
The output should look something like this:
 Total no of records = 239
 Date range of the records from  2004-07-31  to  2014-05-04
 Bounding box of records  5.9241302618 , 72.933495  -
30.475012 , 95.6058760174
 Taxonomic summary...
 No of Families :  16
 No of Genus :  52
 No of Species :  117
Now let us generate a heat-map with geography superimposed. Since we know this project is for Indian subcontinent, we list the countries we need to show on the map.
mapgrid(inat,ptype="records",
        bbox=c(60,100,5,40),
        region=c("India","Nepal","Bhutan",
                  "Pakistan","Bangladesh",
                   "Sri lanka", "Myanmar"),
        title="ReptileIndia records")
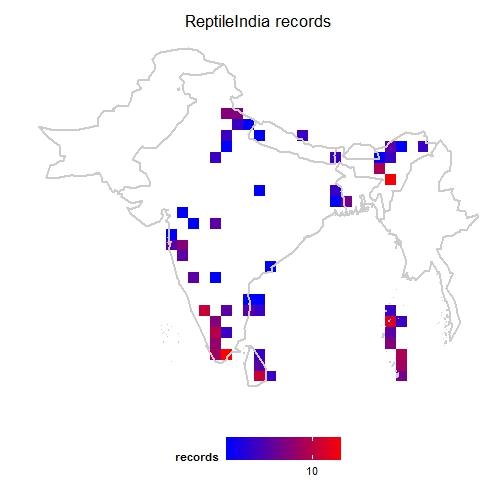
ReptileIndia mapgrid
For temporal visualization we can use tempolar function with plots number of records on a polar plot. The data can be aggregated by day, week or month.
tempolar(inat, color="green", title="iNaturalist daily",
         plottype="r", timescale="d")
tempolar(inat, color="blue", title="iNaturalist weekly",
         plottype="p", timescale="w")
tempolar(inat, color="red", title="iNaturalist monthly",
         plottype="r", timescale="m")

ReptileIndia tempolar daily

ReptileIndia tempolar weekly
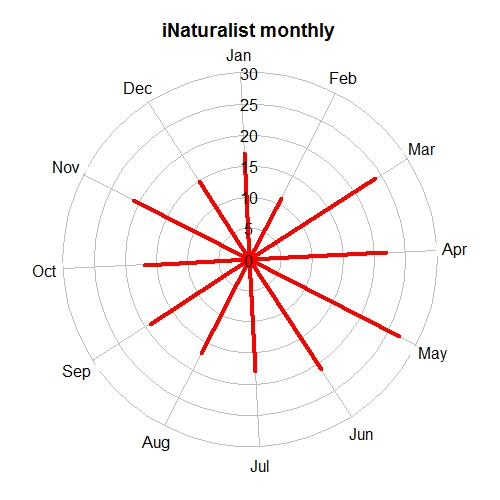
ReptileIndia tempolar monthly
Another interesting temporal visualization is Chronohorogram. This plots number of records on each day with colors indicating the value and concentric circles for each year.
chronohorogram(inat)
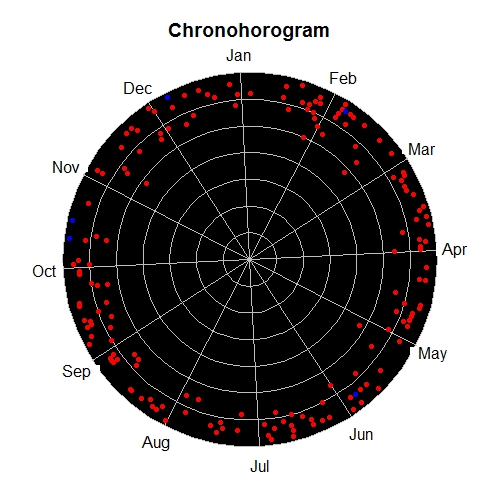
ReptileIndia chronohorogram
And finally for taxonomic visualization we can generate a tree-map of the records. Here the color of each box indicates number of genus in the family and the size of the box indicates proportion of records in the data set of each family.
taxotree(inat)
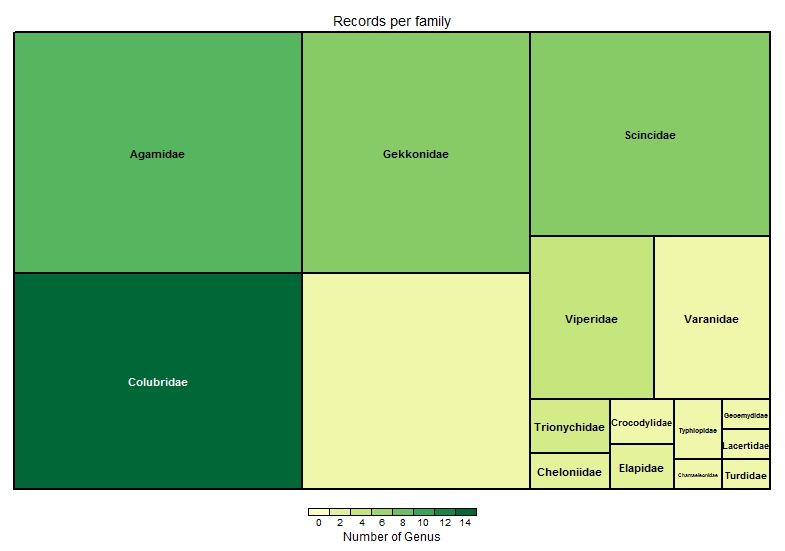
ReptileIndia taxotree
The large empty box at bottom center indicates there are several records which are not identified at family level.
Check the post GSoC Proposal 2014: package bdvis: Biodiversity Data Visualizations for what to expect in near future and comments and suggestions are always welcome.

Looks very interesting Vijay!
Hello, I would like to know that if it would on any biodiv data in csv format. Or, the data need to meet some criterias. I am trying to run this package on my dataset (not from gbif or inaturalist) but have no success so far. I mean I could not use cellid, taxo and other functions. Please help
Hello,If someone is trying to visualize biodiversity data using the above steps,may encounter some errors due to package updates,for example consider the code below.
I am using the “antindia” data for visualization.
Dataset link.
http://www.inaturalist.org/projects/antindia
R Code:
1 install.packages(“bdvis”)
2 install.packages(“rinat”)
3 library(rinat)
4 library(bdvis)
5 inat1<-get_inat_obs_project("antindia")
6 inat1=fixstr(inat1,DateCollected="Observed.on",SciName="Scientific.name")
7 inat1=getcellid(inat)
8 inat1=gettaxo(inat)
9 bdsummary(inat1)
10 tempolar(inat1, color="green", title="iNaturalist daily",
11 plottype="r", timescale="d")
##Now if you try to execute the above line of code,it will display a error stating:-
#Error in tempolar(inat1, color = "green", title = "iNaturalist daily", :
#Date_collected not found in data. Please use format_bdvis() to fix the problem
##This is because the package is updated several times, so there are some changes made.So to remove this error please use the following code changes in line 6,7,8(minor changes) and then functions will work properly.
Now the new R code:-
1 install.packages("bdvis")
2 install.packages("rinat")
3 library(rinat)
4 library(bdvis)
5 inat1<-get_inat_obs_project("antindia")
6 inat1=format_bdvis(inat1,Scientific_name="Scientific.name")
7 colnames(inat1)[which(names(inat1) == "Observed.on")] <- "Date_collected"
8 inat1=getcellid(inat1)
9 bdsummary(inat1)
10 tempolar(inat1, color="green", title="iNaturalist daily",
11 plottype="r", timescale="d")
12 tempolar(inat1, color="blue", title="iNaturalist weekly",
13 plottype="p", timescale="w")
14 tempolar(inat1, color="red", title="iNaturalist monthly",
15 plottype="r", timescale="m")
16 chronohorogram(inat1)
The code for the above visualization can be found at:-
https://github.com/AshwinAgrawal16/bdvis-biodiversity-visualization/blob/master/ant-india%20bdvis%20visualization.txt
Some more example data set visualized visit.
https://github.com/AshwinAgrawal16/bdvis-biodiversity-visualization
If someone is facing further problem with the above code,and if some mistakes please comment 🙂
Thanks @Ashwin for pointing out the error. The error is due to a depreciated function fixstr in this blog entry. The function is replaced with a more powerful and flexible format_bdvis function. So replacing line 6
inat1=fixstr(inat1,DateCollected=”Observed.on”,SciName=”Scientific.name”)
with
inat=format_bdvis(inat,source=’rinat’)
should do the trick.